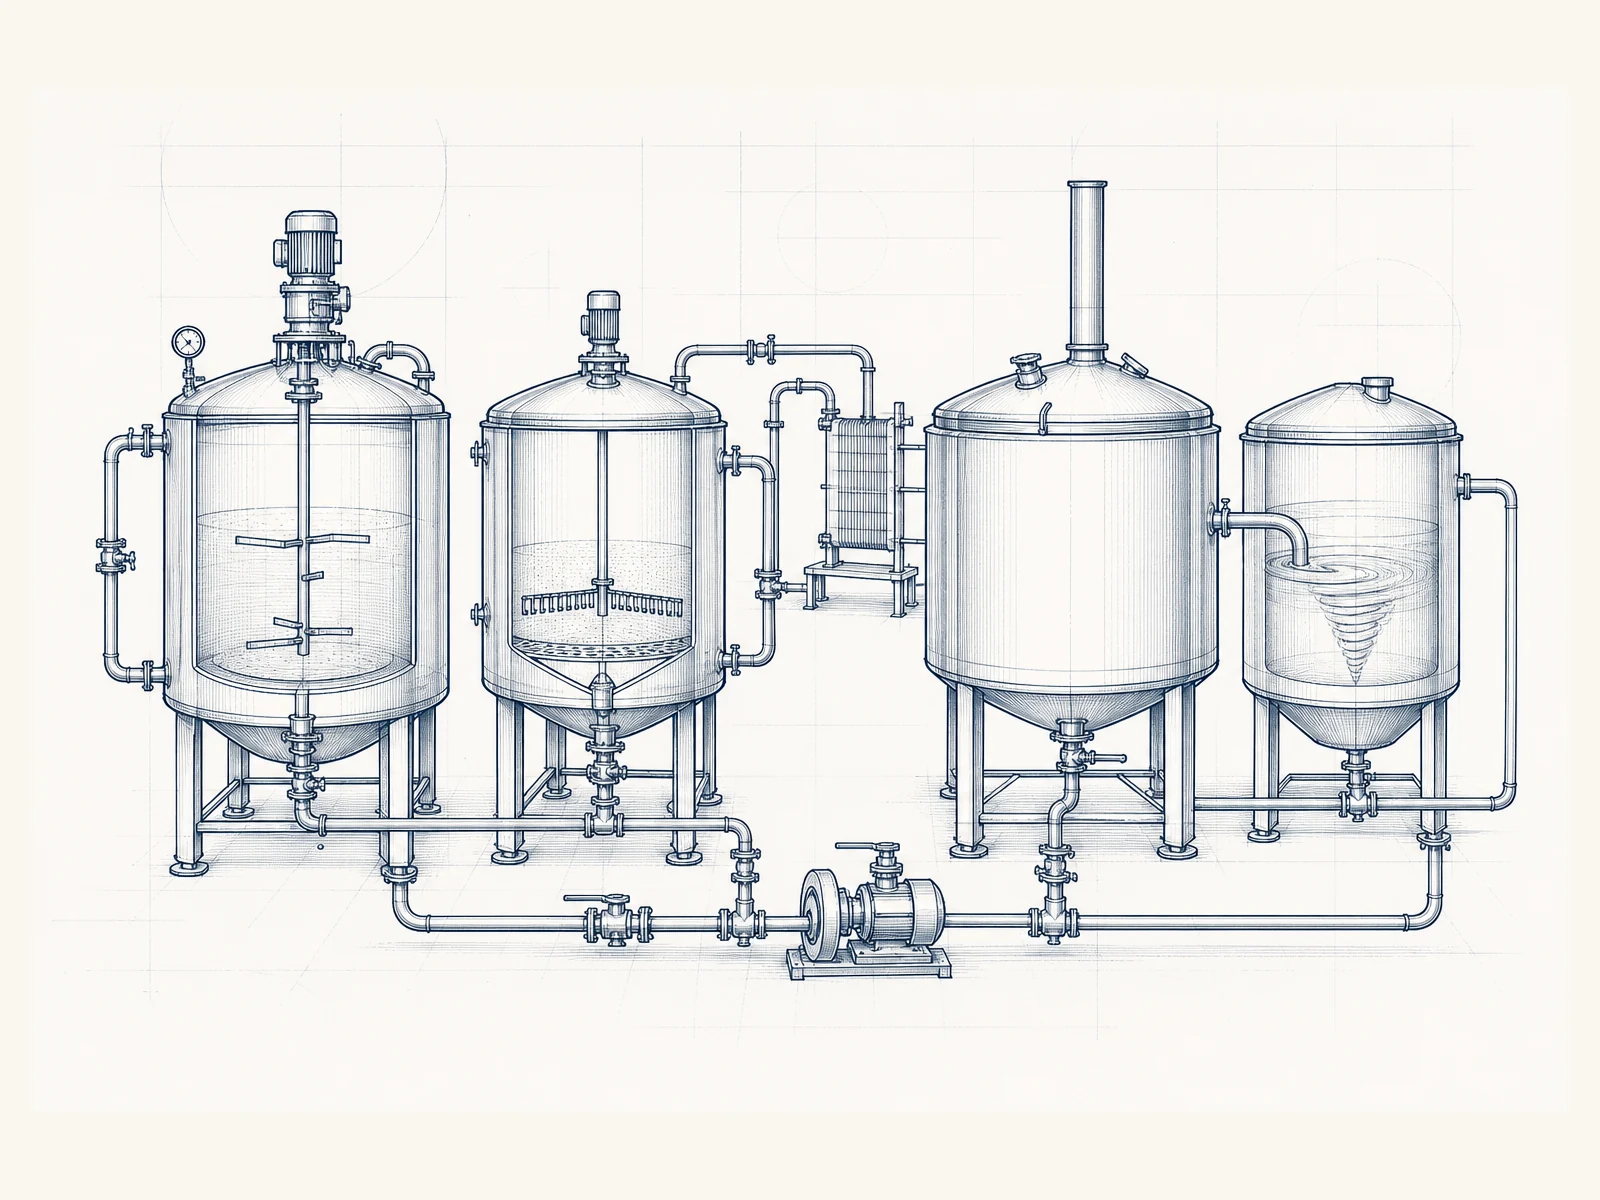
Brewhouse efficiency improvement
What Does a 5-Point Improvement in Brewhouse Efficiency Mean for Your Brewery?
Executive Summary
Improving brewhouse efficiency from 85% to 90% represents a 5.88% relative increase in recovered extract.
For a typical 10 BBL brewhouse, this may represent approximately:
- 0.59 additional BBL per brew
- 1.18 additional full-size kegs
- approximately US$200 in potential gross sales per batch
- lower malt consumption when production volume is maintained
- fewer brews at larger production scales
- improved fixed-cost dilution and better utilization of existing equipment
A 5 percentage-point movement in brewhouse efficiency may look small on a report. In production planning, malt purchasing, wort consistency, cellar capacity and gross sales potential, it can change the economics of a brewery very quickly.

Brewhouse efficiency begins before milling. It begins with the raw material.
A good base malt should not only contribute color, flavor, foam stability and fermentation performance. It must also provide enough extract, in a form the brewery can consistently recover, to achieve the planned volume and original gravity.
Evaluating malt only by the price of a 55 lb bag can lead to the wrong purchasing decision. Two malt lots sold at the same price may differ in moisture, extract, protein, friability, kernel size distribution, beta-glucans, milling behavior and lauter performance.
The first question is: How much does a 55 lb bag of malt cost?
The more important question is: How much does the extract that my brewery can actually recover from that bag cost?
The second question is technically and economically stronger because breweries do not sell bags of malt. They sell beer made from recoverable extract, processed through a real brewhouse with real losses, constraints and measurement variation.
A small difference in malt analysis or brewhouse performance can accumulate into many bags of malt, multiple brews, additional BBL and significant production capacity over a year.
An increase from 85% to 90% is a 5 percentage-point improvement. It is not simply a 5% relative increase. The relative increase in extract recovery is 90 ÷ 85 − 1 = 5.88%.
U.S. brewery units and assumptions
This localized version uses units familiar to breweries in the United States: BBL, US gal, lb, 55 lb malt bags, full-size kegs and U.S. dollar values.
| Conversion | Value |
|---|---|
| 1 BBL | 31 US gal |
| 1 full-size keg | 15.5 US gal |
| 1 full-size keg | 0.5 BBL |
| 1 BBL | 2 full-size kegs |
| 1 malt bag | 55 lb, approximately 24.95 kg |
For the economic examples, base malt is assumed at US$30 per 55 lb bag, or US$30 ÷ 55 lb = approximately US$0.5455/lb. Beer selling price is modeled as US$170 per full-size keg, equivalent to US$340 per BBL for calculation purposes.
Those numbers are not meant to describe every brewery. They create a fixed reference so the effect of a 5 percentage-point improvement can be read consistently across malt cost, production volume and potential gross sales.
Dry Basis Extract vs. As-Is Extract
Dry basis extract excludes the water present in the malt. It is useful for comparing malt potential under standardized laboratory conditions, but it does not describe the product exactly as the brewery receives, stores, weighs and mills it.
As-is extract includes the actual malt moisture. That matters because the brewer buys and weighs a product that contains water. The dry basis number alone does not directly represent how much extract enters the brewhouse.
Using 81.5% dry basis extract and approximately 6% malt moisture, the moisture correction is:
| Step | Calculation | Result |
|---|---|---|
| Moisture correction | 81.5% × 0.94 | 76.61% |
| Working value used in this article | rounded for modeling | 76.5% as-is extract |
| Potential extract in one 55 lb bag | 55 lb × 76.5% | 42.075 lb |
| Recovered extract at 85% | 42.075 × 0.85 | 35.764 lb |
| Recovered extract at 90% | 42.075 × 0.90 | 37.868 lb |
| Additional recovered extract | 37.868 − 35.764 | approximately 2.104 lb per 55 lb bag |
For the calculations in this article, the working value is 76.5% as-is extract. Each pound of malt therefore contains approximately 1.00 lb × 76.5% = 0.765 lb of potential extract.
A 55 lb bag does not contain 55 lb of extract. Under the assumptions used here, it contains approximately 42.08 lb of potential extract before brewhouse losses.
That distinction is one of the main reasons price per bag is not enough. What matters is the cost of the extract the brewery can actually recover into wort.
Malt Potential Is Not Brewhouse Efficiency
The malt COA indicates potential performance under standardized laboratory conditions. Brewhouse efficiency indicates how much of that potential is actually recovered in the wort at the brewery’s selected measurement point.
Brewhouse efficiency =
Extract recovered in the wort ÷ Potential extract in the malt
A brewery can buy excellent malt and still recover less extract than expected when the process is not stable. Milling, grist distribution, liquor-to-grist ratio, mash pH, mash profile, enzymatic conversion and mash mixing all influence how much extract becomes available before lautering even begins.
After conversion, lautering and sparging decide how much of that available extract is recovered. Grain-bed formation, wort recirculation, runoff rate, channeling, dead volume and sparge control can turn a good mash into a lower-than-expected kettle yield.
Measurement can also distort the result. Volume measurement, gravity measurement, representative sampling, temperature correction, instrument calibration and operating standardization all affect whether the reported efficiency reflects the process or only inconsistent data collection.
Measurement Method
Brewhouse efficiency values can only be compared when the brewery uses the same definition, measurement point and calculation method.
Efficiency measured pre-boil, post-boil, at knockout or in the fermenter can produce different values because losses, evaporation, trub separation, shrinkage and transfer practices are not the same at each point.
For internal tracking, the brewery should define one method and repeat it consistently. That means temperature-corrected volume, calibrated flowmeters or vessel volume marks, accurate gravity measurement, representative sampling, consistent timing and a clearly defined measurement point.
The goal is not to invent one universal number for every brewery. The goal is to make the brewery’s own number reliable enough to support technical and financial decisions.
From 85% to 90%
Moving from 85% to 90% is an improvement of 5 percentage points. It is not simply a 5% relative increase.
Relative increase:
90 ÷ 85 − 1 = 5.88%
With the same malt load, the brewery recovers approximately 5.88% more extract. Using the as-is extract assumption of 76.5%, the recovered extract is:
At 85%: 0.765 × 0.85 = 0.65025 lb of recovered extract per lb of malt.
At 90%: 0.765 × 0.90 = 0.6885 lb of recovered extract per lb of malt.
The difference is 0.03825 lb of additional extract per lb of malt. Across a 55 lb bag, that is approximately 2.10 lb of additional extract recovered per bag.
On one pound, the number looks small. Across hundreds or thousands of bags, it becomes production volume, fewer raw-material purchases, improved capacity utilization or additional full-size kegs available for sale.
Example: 10 °P, Approximately OG 1.040
To keep the example practical, the article uses a reference beer around 10 °P, approximately OG 1.040.
A 10 °P wort contains approximately 10% extract by mass. Original gravity is an expression of density. For this example, 10 °P and OG 1.040 are close enough to explain the production impact without turning the article into a conversion table.
The important point is that efficiency is not just an abstract percentage. It determines how much extract from the malt becomes wort at the intended concentration and volume.
Option 1: lower malt cost
The first economic path is to produce the same amount of beer using less malt. The table below keeps production volume fixed and shows how much malt would be required at 85% versus 90% brewhouse efficiency.
| Production | Malt @85% | Malt @90% | Saved | Savings |
|---|---|---|---|---|
| 1 BBL | 41.38 lb | 39.08 lb | 2.30 lb | US$1.25 |
| 10 BBL | 413.77 lb | 390.79 lb | 22.99 lb | US$12.54 |
| 100 BBL | 4,137.73 lb | 3,907.86 lb | 229.87 lb | US$125.38 |
| 1,000 BBL | 41,377.29 lb | 39,078.55 lb | 2,298.74 lb | US$1,253.86 |
| 100,000 BBL | 4,137,729 lb | 3,907,855 lb | 229,874 lb | US$125,385 |
The main result is the malt saved. At small volume, the savings may look modest. At larger annual volume, the same percentage-point improvement can represent thousands of pounds of malt and a meaningful raw-material cost reduction.
This path is useful when the brewery wants to protect recipe targets, reduce raw-material consumption or stabilize production cost without necessarily increasing output.
Option 2: increase production with the same malt load
The second economic path is to maintain the same malt load and convert the efficiency improvement into additional volume. The formula is: New production = original production × 90 ÷ 85.
| Original Production | Potential Production at 90% | Additional Production | Full-Size Keg Equivalent |
|---|---|---|---|
| 1 BBL | 1.0588 BBL | 0.0588 BBL | 0.1176 kegs |
| 10 BBL | 10.5882 BBL | 0.5882 BBL | 1.1765 kegs |
| 100 BBL | 105.8824 BBL | 5.8824 BBL | 11.7647 kegs |
| 1,000 BBL | 1,058.8235 BBL | 58.8235 BBL | 117.6471 kegs |
| 100,000 BBL | 105,882.3529 BBL | 5,882.3529 BBL | 11,764.7059 kegs |
This table shows the physical production effect. A 5 percentage-point gain does not mean the brewery magically adds capacity everywhere, but it does mean the same malt load can support more extract recovery and therefore more wort at the reference strength.
When that additional BBL can move through the kettle, whirlpool, heat exchanger, fermenters, cellar, packaging and sales pipeline, it becomes saleable volume.
At US$170 per full-size keg, potential gross sales are calculated as additional BBL × 2 × US$170.
| Original Production | Additional BBL | Equivalent Full-Size Kegs | Potential Gross Sales |
|---|---|---|---|
| 1 BBL | 0.0588 BBL | 0.1176 kegs | $20.00 |
| 10 BBL | 0.5882 BBL | 1.1765 kegs | $200.00 |
| 100 BBL | 5.8824 BBL | 11.7647 kegs | $2,000.00 |
| 1,000 BBL | 58.8235 BBL | 117.6471 kegs | $20,000.00 |
| 100,000 BBL | 5,882.3529 BBL | 11,764.7059 kegs | $2,000,000.00 |
This is potential gross sales revenue, not profit. It does not automatically account for federal excise tax, state taxes, distributor margin, keg depreciation, packaging, freight, sales commission, labor, utilities, losses after the brewhouse or other variable costs.
Example: a 10 BBL brewhouse
A 10 BBL brewhouse improving from 85% to 90% efficiency could potentially produce approximately 0.59 additional BBL per brew with the same malt load, equivalent to about 1.18 full-size kegs and US$200 in potential gross sales revenue.
| Metric | Calculation | Result |
|---|---|---|
| Output at 85% | reference batch | 10.00 BBL |
| Output at 90% | 10 × 90 ÷ 85 | 10.5882 BBL |
| Additional production | 10.5882 − 10.00 | 0.5882 BBL |
| Full-size keg equivalent | 0.5882 × 2 | 1.1765 kegs |
| Potential gross sales | 1.1765 × US$170 | approximately US$200.00 per batch |
This does not automatically require more malt, another brewhouse, another brew or immediate expansion. It uses the same malt load more effectively.
Whether that volume can be captured depends on available capacity in the kettle, whirlpool, heat exchanger, fermenters, cellar, cooling, packaging and sales. Efficiency creates the opportunity; the rest of the operation determines how much of that opportunity becomes finished beer.
Fewer brews required
Another way to evaluate the same efficiency improvement is batch reduction. With a 10 BBL brewhouse, effective batch output at 90% becomes 10.5882 BBL.
| Production Target | Batches at 85% | Batches at 90% | Complete Batches Avoided |
|---|---|---|---|
| 10 BBL target | 1 batch | 1 batch after rounding up | No complete batch avoided |
| 100 BBL target | 10 batches | 10 batches after rounding up | No complete batch avoided |
| 1,000 BBL target | 100 batches | 95 batches after rounding up | Approximately 5 batches avoided |
| 100,000 BBL target | 10,000 batches | 9,445 batches after rounding up | Approximately 555 batches avoided |
A small brewery may not eliminate a complete brew at low volume, but it still creates additional volume. Complete brews are avoided only when the accumulated gain exceeds the effective size of one brew.
When calculating required brews, the production target must be met in full, so the practical result is rounded up. This matters for scheduling, labor exposure, tank planning and equipment occupancy.
Operating costs cannot be converted from another market
This article does not convert Brazilian gas, steam, labor or cost-per-liter assumptions into U.S. dollars. Exchange-rate conversion would create false precision.
Each brew may involve labor, steam or natural gas, water, cleaning chemicals, cooling, pumping, oxygen, wastewater treatment, maintenance, equipment occupancy and scheduling time.
The economic value of an avoided brew must be calculated with the brewery’s actual labor, utility, water, chemical, wastewater and maintenance costs.
Potential gross sales are also not the same thing as margin or net profit. They are a top-line way to estimate the value of volume that could be produced and sold before deducting the real costs of making and selling that beer.
Two Different Economic Paths
Option 1 — Produce the Same Volume With Less Malt
In this path, the gain appears as lower malt consumption, lower raw-material cost, potentially fewer brews when accumulated volume permits, lower utility demand, lower labor exposure and lower equipment occupancy.
Option 2 — Keep the Same Malt Load and Produce More Beer
In this path, the gain appears as additional BBL, additional full-size kegs, greater production per labor hour, better fixed-cost dilution, delayed capital investment and higher potential gross sales.
The brewery cannot count the full malt savings and the full additional production from the same malt at the same time. These are alternative ways of using the same efficiency improvement.
A brewery may adopt a partial combination, such as reducing some malt while also gaining some volume, but the same benefit should not be counted twice in the financial analysis.
Efficiency Can Also Reduce Fixed Cost per BBL
When the brewery produces more BBL using the same building, management structure, core team and brewhouse, fixed costs are distributed across a larger saleable volume.
Fixed cost per BBL =
Total fixed cost ÷ Saleable BBL
This does not replace contribution margin analysis, but it helps owners and production managers understand why better efficiency can affect more than malt cost. It can improve how the existing operation absorbs rent, salaries, insurance, administrative structure and other fixed commitments.
Efficiency Should Not Be Pursued at Any Cost
Improving efficiency does not mean oversparging, driving last-runnings pH too high, extracting unwanted compounds, extending lautering excessively, collecting overly dilute wort, increasing boil-off unnecessarily, transferring malt savings into higher energy cost, compromising flavor, compromising stability or disrupting production scheduling.
The best result is not necessarily the highest efficiency number.
The best result is the balance between extract recovery, wort quality, lautering time, energy, labor, stability, capacity and profitability.
For that reason, efficiency work should be connected to sensory quality, process stability and commercial goals. A higher number that damages beer quality or slows the brewhouse may be worse than a slightly lower number that is repeatable, clean and profitable.
What Does It Cost Not to Measure?
Every brewery should be able to answer a few operational questions: How much potential extract enters the brewhouse? How much extract reaches the fermenter? How much remains in the spent grain? How much is lost in trub?
It should also know the average brewhouse efficiency, how much it varies from brew to brew, what one percentage point is worth, what each brew actually costs, how much the current equipment could produce and how much saleable volume is being left behind.
Efficiency is not only about using less malt. It is about converting raw materials, equipment, utilities, labor and time into more consistent, saleable beer.
What Can a 5-Point Improvement Represent?
A five-point improvement in brewhouse efficiency is much more than a better number on a production report.
Depending on how the brewery chooses to use that gain, it may represent:
- lower malt consumption;
- additional BBL produced with the same malt load;
- fewer brews to reach the same annual target;
- better utilization of labor and utilities;
- improved fixed-cost dilution;
- delayed investment in additional brewing capacity;
- higher potential gross sales.
The calculator below allows these concepts to be applied using your own production data.
Apply the Same Logic to Your Brewery
The examples above use fixed assumptions. The calculator below allows brewery owners and production teams to apply the same proportional efficiency model to their own monthly production, current efficiency and full-size keg selling price.
Brewhouse efficiency calculator for U.S. breweries
Enter your current production data to estimate how much additional volume and potential gross sales a brewhouse efficiency improvement could represent.
This simulation keeps the same malt load and number of brews, converting the efficiency gain into additional beer volume.
Simulation results
The simulation assumes that the efficiency improvement is converted into additional volume while maintaining the same malt load and number of brews.
The alternative of producing the same volume with less malt requires additional information about the recipe, wort gravity, malt analysis and process costs.
This calculator estimates production capacity and potential gross sales based on a proportional improvement in brewhouse efficiency. It does not estimate net profit or guarantee production, revenue or savings.
Actual results depend on malt quality, recipe, milling, mashing, lautering, sparging, measurement accuracy, brewhouse configuration, kettle capacity, whirlpool capacity, cooling, fermentation capacity, packaging losses, tank availability, sales demand and other operational constraints.
Methodology and Technical Disclaimer
The calculations use a simplified proportional model to show the possible impact of moving from 85% to 90% brewhouse efficiency under fixed assumptions. They are educational examples, not guarantees of production, revenue, savings or profitability.
Actual results depend on malt analysis, recipe design, milling, mash conversion, lautering, sparging, brewhouse configuration, tank capacity, cooling, packaging losses, sales demand, labor cost, utilities, tax structure and the brewery's own measurement method.
Technical references
The concepts presented in this article are based on internationally recognized brewing references covering malt analysis, brewhouse efficiency, laboratory methods, process measurements and brewing operations.
- Brewers Association — technical resources for U.S. breweries.
- Master Brewers Association of the Americas — MBAA.
- American Society of Brewing Chemists — ASBC.
- Wolfgang Kunze, Technology Brewing & Malting.
- VLB Berlin technical brewing references.
- Alcohol and Tobacco Tax and Trade Bureau — TTB: one beer barrel equals 31 U.S. gallons.
Add This Content to Your Brewery's Technical Library
Download the technical PDF version for reference, printing and team training.
What Could a 1-, 3- or 5-Point Efficiency Improvement Mean for Your Brewery?
Every brewery has different raw materials, equipment, process limitations and operating costs. RE BREW evaluates extract balance, brewhouse performance and production constraints to identify where losses occur and which improvements offer the strongest technical and financial potential.